This page is still being written.
Neuroscales
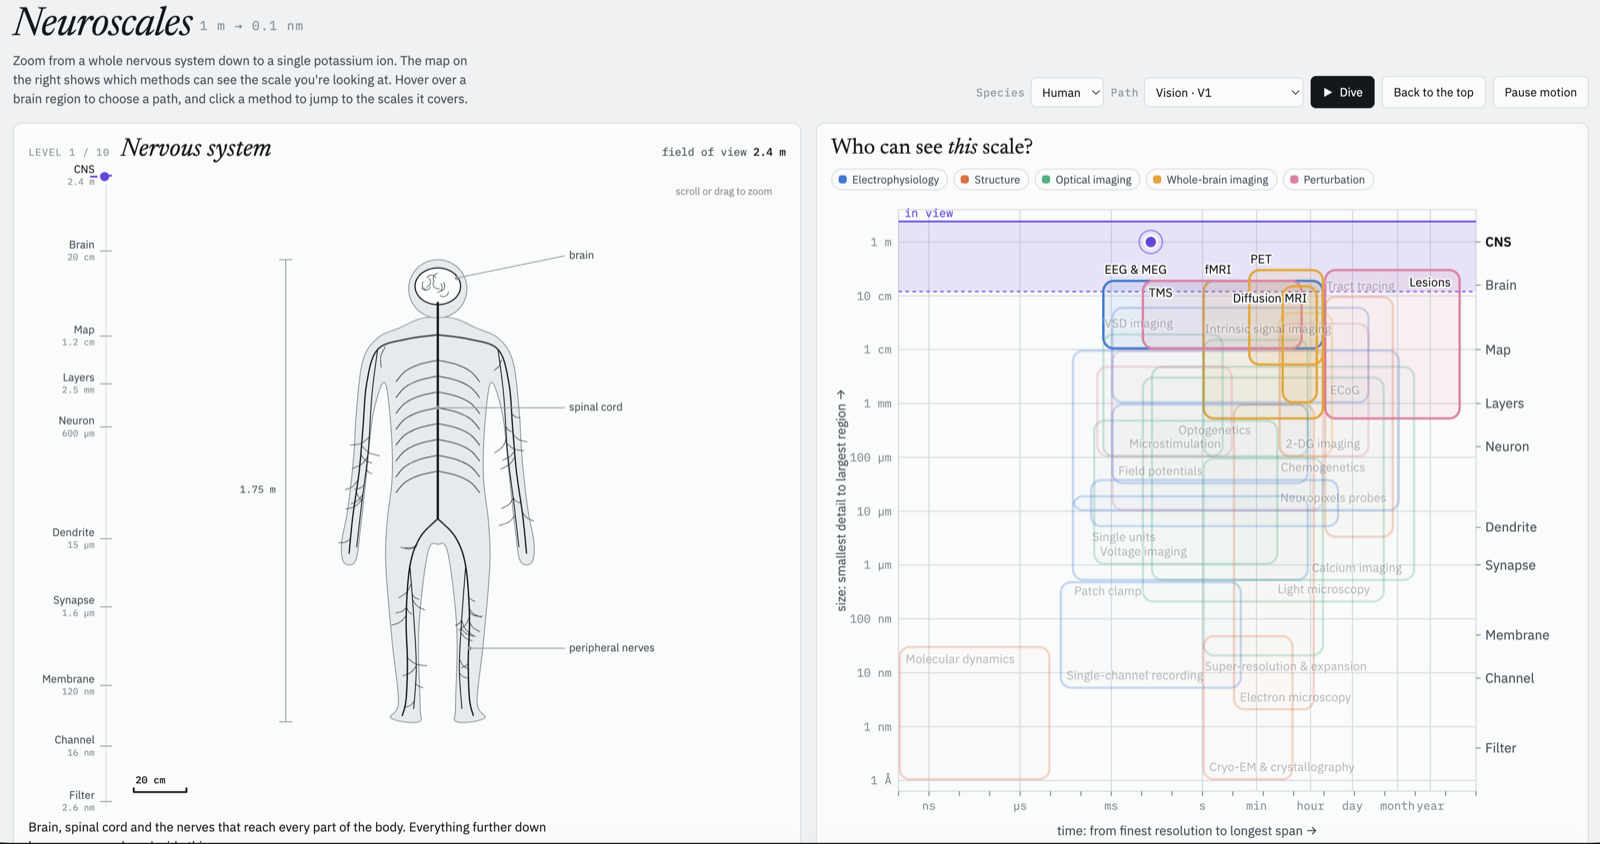
Zoom from the whole brain down to ion channels, and see which methods can measure each scale.
Open Neuroscales (work in progress) →
What it is
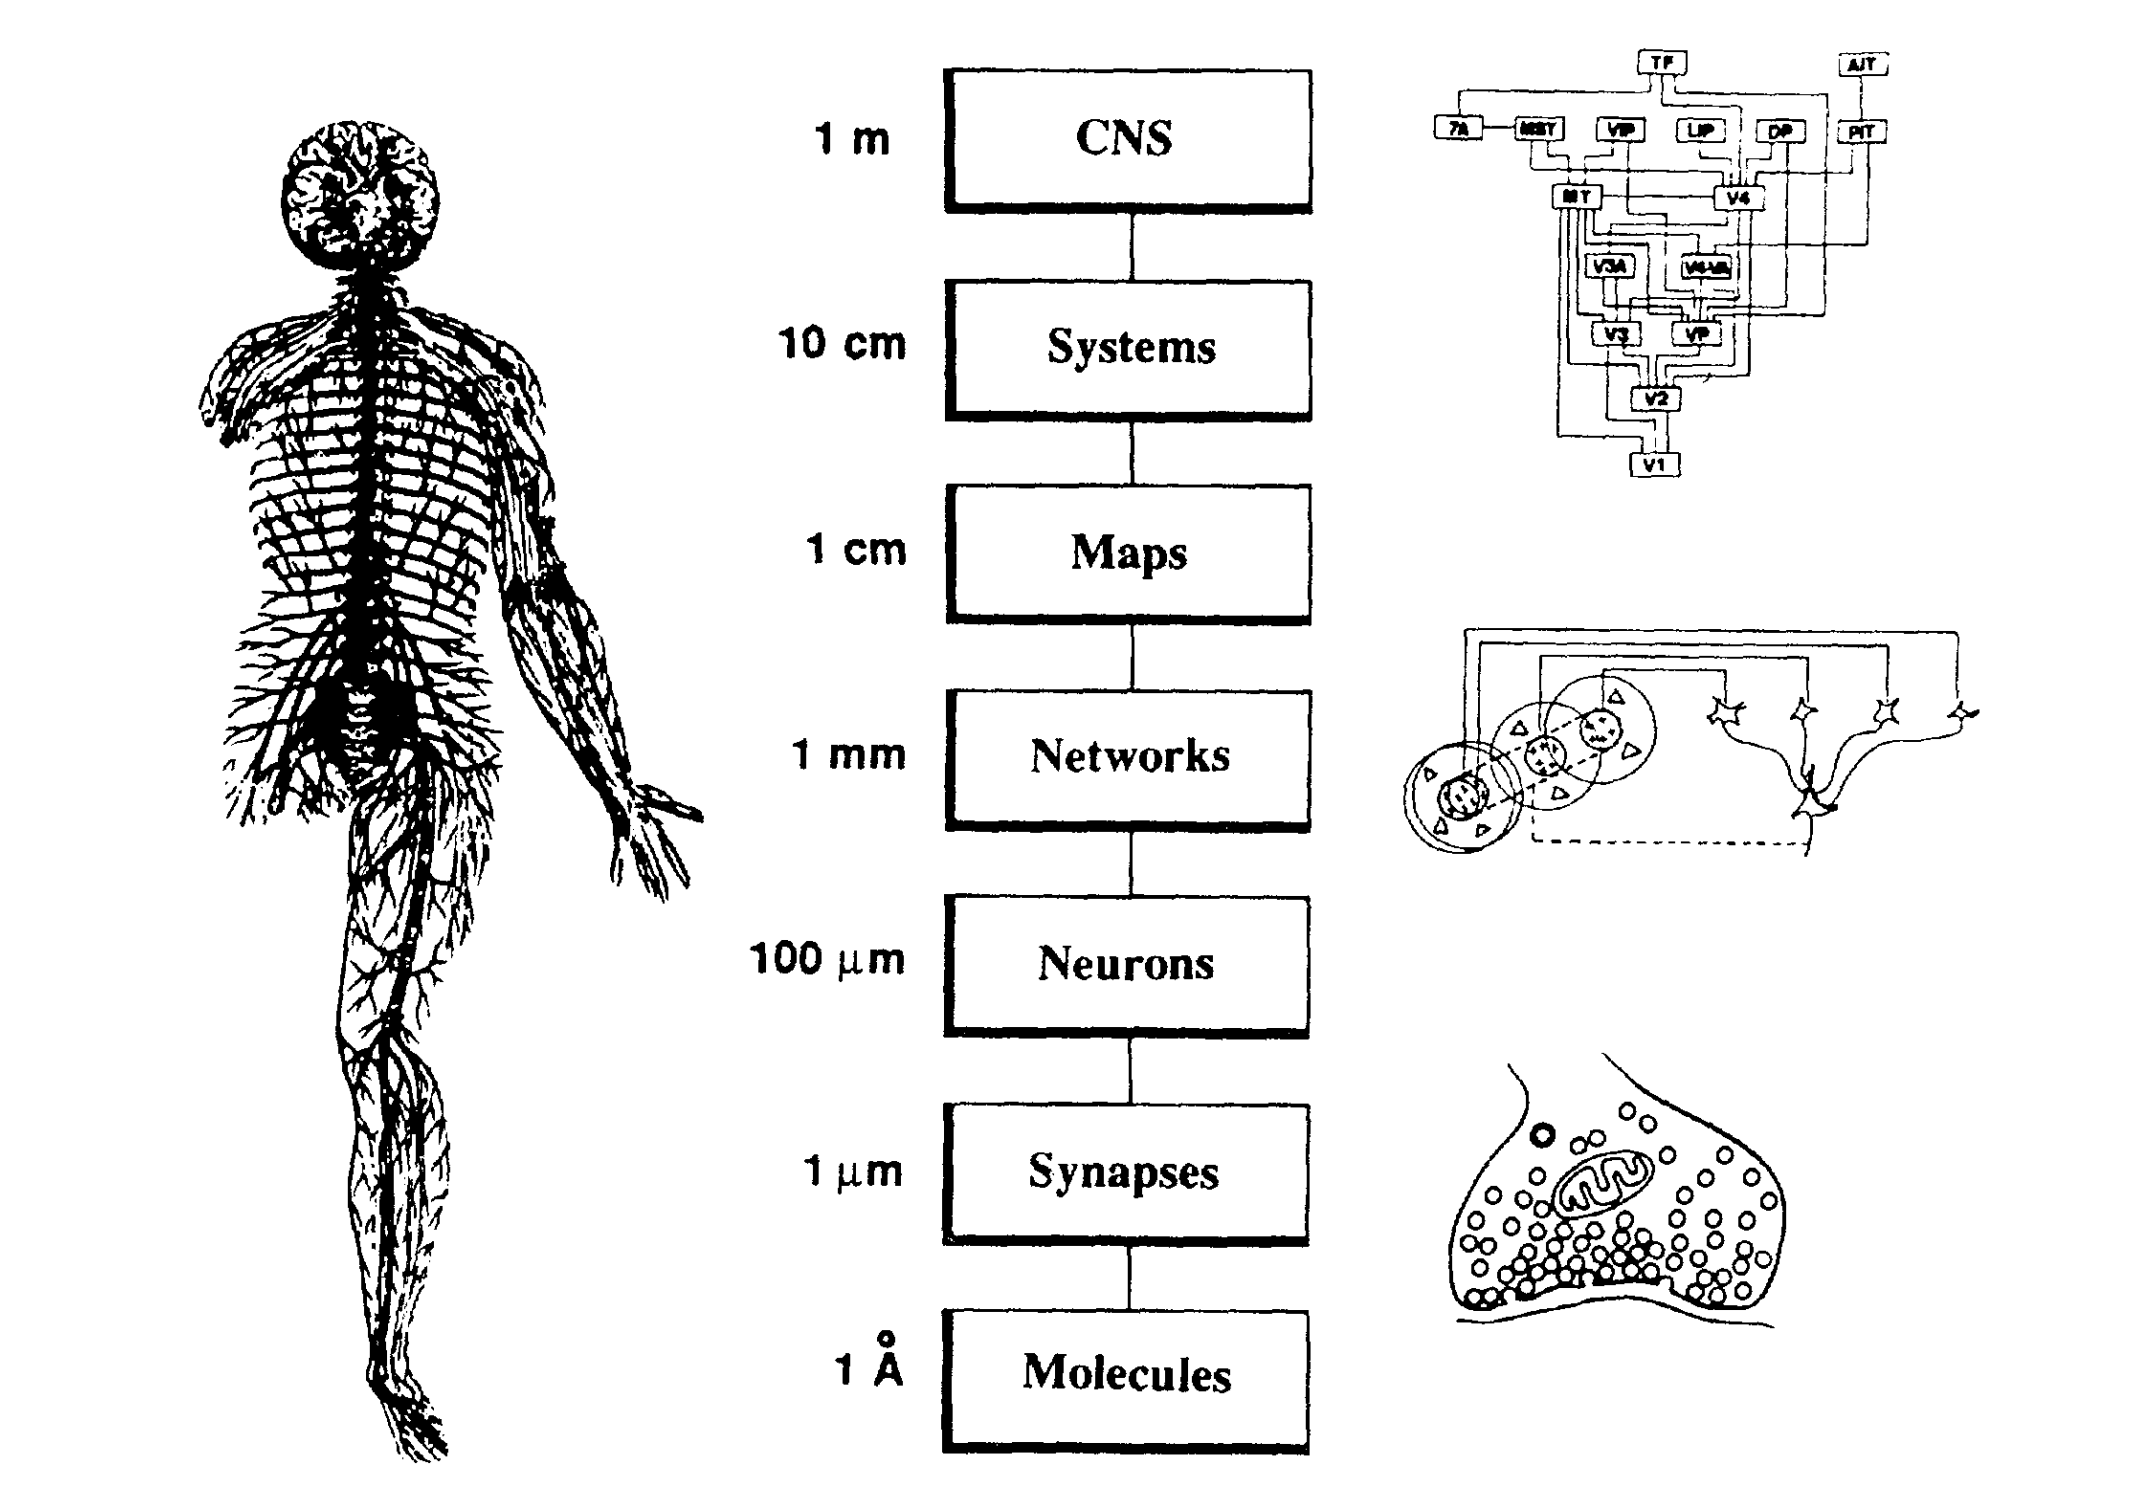
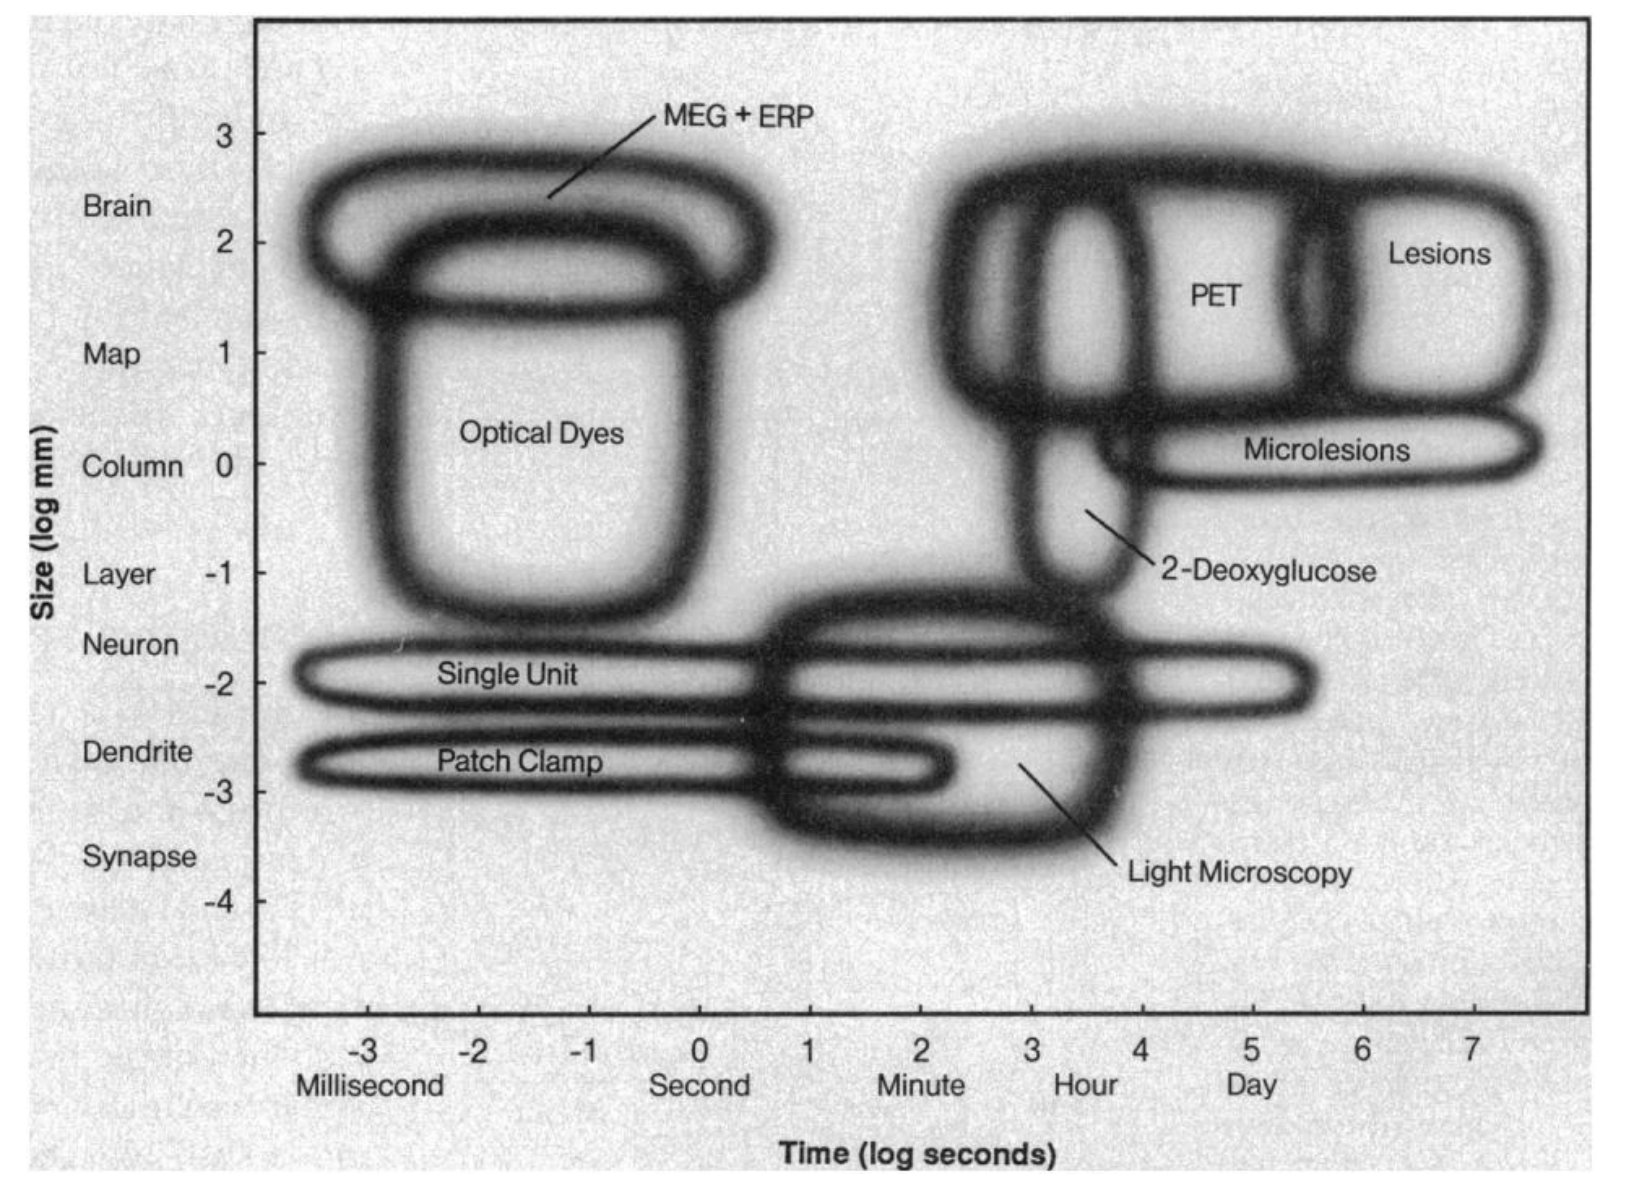
Neuroscales is based entirely on Patricia Churchland and Terrence Sejnowski's original idea and figures, from their 1988 paper Perspectives on cognitive neuroscience (Paper ↗ · PubMed ↗). Their Figure 1 lays out the levels of organization of the nervous system, from the whole CNS down to molecules, and their Figure 3 maps the range of sizes and times each experimental method can measure. This project turns those two figures into something you can zoom through and explore.
How it works
The interesting parts of how it was built.
How it was made
How it was made: notes on my role and any AI assistance coming soon.
Links
Neuroscales, the interactive version (still under construction).